

 Madeleine Lopeman


How AI Can Keep P&C Insurers Profitable
How can P&C insurers remain profitable in 2024?
Over the weekend of December 10-11, a cluster of severe tornadoes passed across large swaths of the central and southern United States, causing widespread damage and tragic loss of life. The National Weather Service reported a total of 61 tornadoes and received over 400 hazard and damage reports throughout the area (https://www.weather.gov/crh/dec112021).
In the aftermath of such an event, it can be challenging to assess the degree and distribution of damage to the built environment to optimize response efforts and best support local communities. The National Weather Service mobilizes in the wake of severe tornadoes to perform on the ground damage surveys, but these damage maps can take weeks or months to complete and are quite resource intensive.
To assist in the recovery efforts, Betterview has created preliminary, high resolution damage maps that quantify the degree of damage experienced at the parcel level across the impacted region.
Insurance companies can leverage this post-storm analysis to quickly understand the impact to their portfolio on an individual policy level, allowing claims departments to proactively reach out to affected customers rather than passively waiting for claims to come through. Identification of large damage clusters within the affected regions can help claims departments optimize on-the-ground resources immediately after the event, sending teams out to the regions in the greatest need. Whether for CAT response team deployment, checking in with agents in the affected areas, or pre-notifying policyholders, fast post-event damage analysis can be a game changer for insurance companies in the wake of a devastating event.
By feeding high-resolution aerial imagery of the affected regions taken on December 12 by the Geospatial Insurance Consortium (GIC) and its operations partner Vexcel through Betterview’s proprietary intelligence systems, we were able to quickly identify the degree of damage on over 25,000 properties in the affected region.
Mayfield, KY was one of the areas hardest hit by the tornadoes, but the damage wasn’t distributed evenly throughout the city.
Let’s take a look at a few before/afters in the area.
|
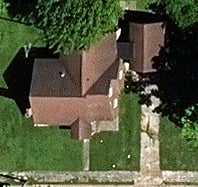
May 2021 |
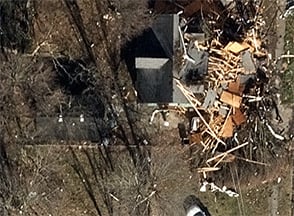
Dec 12, 2021 |
|
|
|
|
|
|
|
Imagery courtesy of Geospatial Insurance Consortium
|
|
The buildings in the above images are on the same block in Mayfield, KY, less than 200 ft away from one another. However, the first building came out relatively unscathed, whereas the second was destroyed. Thorough review of the imagery reveals that, even within such a small region, the damage from a tornado can vary greatly across relatively small distances.
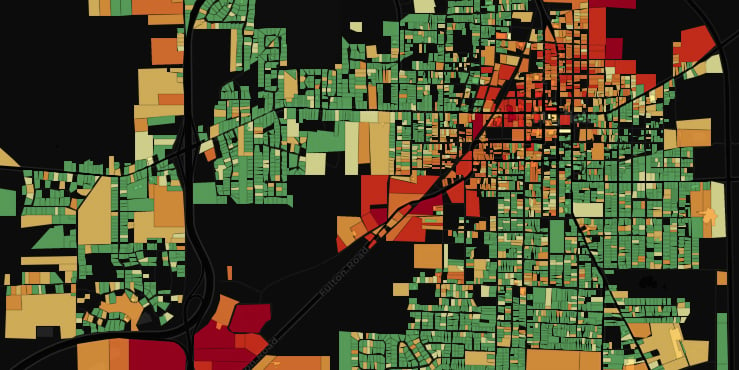
To understand this small-scale variation in damage, as well as the regional impact of the tornado, Betterview generated the following map, which shows the degree of damage on each individual property in the downtown Mayfield area, highlighting exactly where the tornado tore through the city.

Through our analysis, we found that of the 25,000+ properties within the vicinity of the tornado tracks we studied, 25% experienced some level of damage. And we know exactly where every one of those properties is located.
Within hours of the tornadoes, radar-indicated tornado tracks were made available by Canopy Weather, a Betterview partner that is providing weather data through Betterview’s PartnerHub platform.

This type of data can be highly valuable as it highlights the areas that were likely affected by the storms with a very short turnaround.
Properties inside and near the tornado tracks are likely to have been damaged, but due to the nature of radar-indicated tornado tracks, identifying the degree of damage present to individual properties and structures is difficult. Weather radar detects rotation in a storm’s updraft, thousands of feet above the ground. The tornado itself is connected to the rotating updraft, but the funnel can be narrower or tilted off the axis of the updraft. While radar-indicated tornado tracks are fast to produce, they require additional property intelligence to tell the full story of the storm’s impact.
Let’s take a look at the map of the damage in Bowling Green, KY, below. The outline of the radar-indicated track that passed over the community is shown in white. On the northern edge of the track, where the funnel touched down, one can see the property-level Betterview damage assessment.
The tornado damage track is clearly visible in the strip of properties that experienced damage on the northern edge of the radar-indicated track, while many of the properties inside the track remained relatively unscathed.

By combining radar-indicated tornado track data from Canopy Weather, and Gray Sky imagery from the Geospatial Insurance Consortium through Betterview’s PartnerHub with post-event property intelligence generated by Betterview, insurance companies and other agencies can obtain the most complete and accurate assessment of damage within hours of a natural catastrophe.
In addition to analyzing the impact at the individual property level, Betterview’s data also allows us to examine the geospatial damage patterns across the entire length of the track. In the following maps, we’ve aggregated the damage found in several areas hit by the tornadoes. Larger cells have more buildings, and smaller cells have fewer. The darker red cells had a greater density of damage detected in the region, while the yellow areas had less damage and more properties that survived.
Distribution of damage in Mayfield, KY.
Distribution of damage in Bowling Green, KY.
Distribution of damage near Earlington, KY.
Distribution of damage in St. Charles, MO.
Distribution of damage near Jonesboro, AR.
Distribution of damage near Tiptonville, TN.
This analysis highlights the degree to which different regions were impacted by the storms overall, and where the damage is concentrated. Consistent with initial media reports, much of the most severe damage can be found in Mayfield, KY. However, several other hot spots also emerge through this analysis, including sections of Earlington, KY and Tiptonville, TN. The other areas considered suffered comparatively less damage, including two of the more densely populated areas—Bowling Green, KY and St. Charles, MO—as well as Jonesboro, AR.
Just as we saw on the individual parcels before, the areas directly over the tracks are not always the darkest, meaning that some areas further away from the tracks may have suffered widespread damage, further underscoring our finding that tornado hazard data alone may not tell the full story of a severe convective storm’s impact.
Here at Betterview, we know the post-event response to a devastating event like this can be challenging to navigate. We believe that our technology can assist those efforts by uncovering the impact of the storm across the region. Our research on this and other natural catastrophes is ongoing to develop new ways to predict and prevent catastrophic damage in the future.

Madeleine Lopeman leads Betterview's Data Science team, which crafts datasets used to train Betterview's models, evaluates models to measure and improve performance, and conducts studies to quantify the value of Betterview's data for insurance carriers. Madeleine received her PhD from Columbia University and has held positions at Guy Carpenter and Blackboard Insurance.
How can P&C insurers remain profitable in 2024?
What does the Nearmap acquisition of Betterview mean for the insurance industry?

The insurance industry, and the technology that supports it, have seen significant change over the last few years. New technology continues to come...