

 Meadow Green
How AI Can Keep P&C Insurers Profitable
How can P&C insurers remain profitable in 2024?
Betterview’s Wildfire Risk Insights empower P&C insurers like you to predict and prevent wildfire damage. These insights combine computer vision tools with trusted partner data, creating a comprehensive view of overall wildfire risk. Leverage our Wildfire Risk Insights today – including the predictive Wildfire Vulnerability Score – to expand business in fire-prone regions, streamline underwriting efficiency, and provide better protection for policyholders.
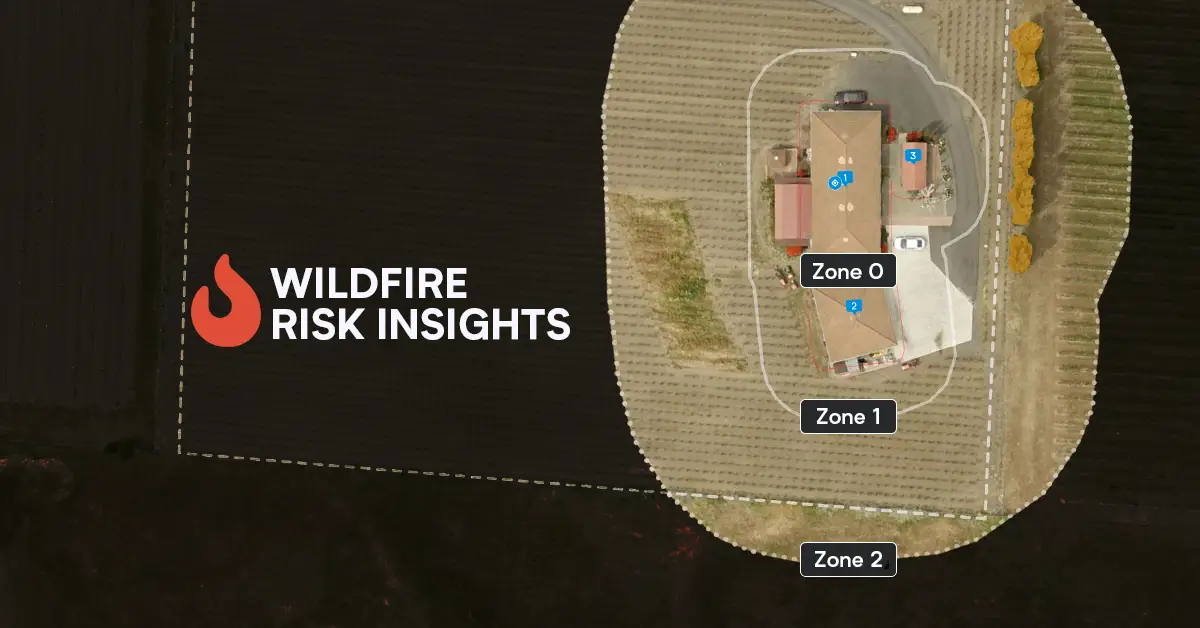
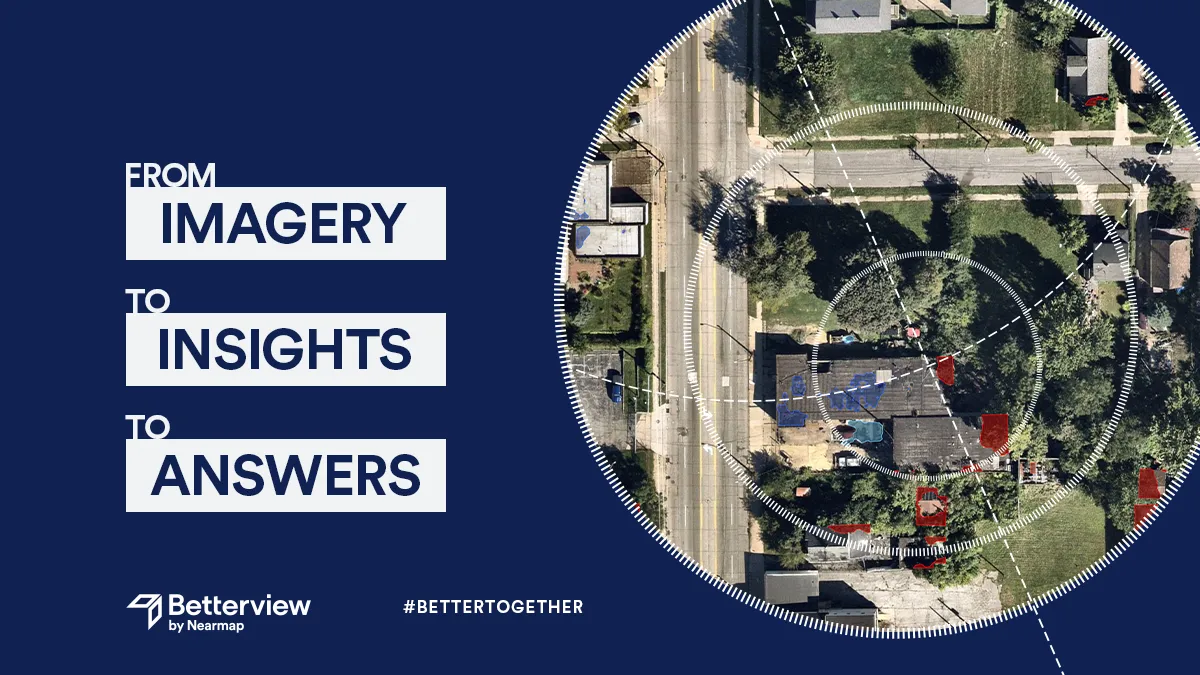
Determine Structural Vulnerability with Computer Vision
The first relevant factor for Wildfire Risk Insights is property-level vulnerability, which refers to the factors on a property that determine the extent of damage it will experience during a wildfire event. Our computer vision models can detect over 60 unique property attributes. Many of these attributes – particularly defensible space, roof material, and roof condition – are strongly correlated with future wildfire damage.
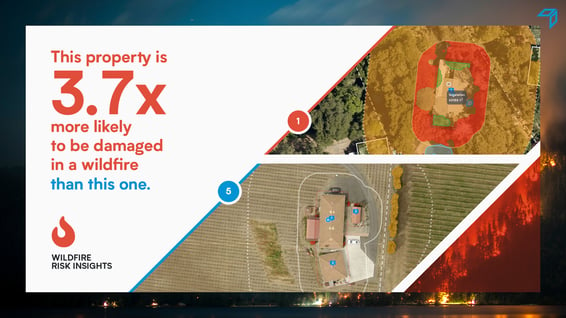
Our Wildfire Vulnerability Score combines the most relevant detections into a single, reliable indicator of overall vulnerability. This score is highly predictive of losses: an internal study found that high-risk properties (scoring a 1) were nearly 4 times more likely to experience damage than low-risk properties (scoring a 5). Insurers can use this score to effect immediate policy action, flagging high-risk properties for an inspection while straight-through-processing safer risks. Often ignored by other industry solutions, property-level vulnerability is a crucial part of any Wildfire risk solution.
Unlocking Context: The Power of Partner Data
Vulnerability is not the full story – hazard is just as important. In contrast to vulnerability, hazard refers to environmental, historical, and societal factors that determine the probability a property will experience a wildfire event. Both factors are critical to consider: a property might have a poor vulnerability score but be located in a low-hazard region, reducing its total risk. To calculate hazard, our Partner Connect program sources third-party data from the most reliable companies in the insurtech industry. Partner Connect provides crucial context for a full picture of wildfire risk. This data enhances our own structural vulnerability detections with regional hazard and community-level vulnerability.
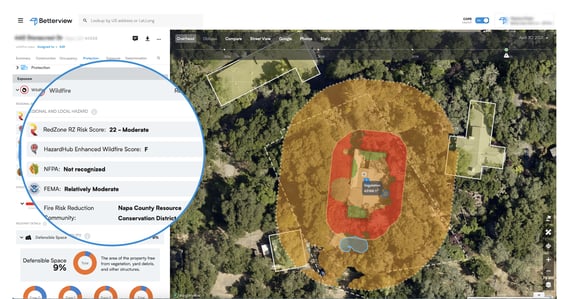
In addition to hazard data, we also pull third-party data relevant to community-level vulnerability. Community vulnerability considers how a property’s vulnerability is affected by other properties nearby. Betterview users can access a map of communities with the Firewise USA certification from the National Fire Protection Association (NFPA), and Fire Risk Reduction Communities from the California Board of Forestry and Fire Protection. This information helps insurers comply with California’s Safer from Wildfire Framework; a new regulation designed to protect policyholders in the state.
Together with structural vulnerability, community vulnerability and regional hazard form a holistic picture of wildfire risk – one that would not be possible without our trusted partners.
The Benefits for Insurers
Insurers can get ahead of wildfire risk today by using all these insights in a single, easy-to-use platform. Benefits of the solution include:
We strive to help our customers better identify and mitigate wildfire risk by training new models and adding more wildfire hazard and vulnerability data. We are even building an emerging solution to predict the likely path of a wildfire, based on complex factors like wind speed, wind direction, and LiDAR tree detections. To access all of these solutions – and to protect your customers while increasing profitability in wildfire zones – reach out today.
How can P&C insurers remain profitable in 2024?
What does the Nearmap acquisition of Betterview mean for the insurance industry?

The insurance industry, and the technology that supports it, have seen significant change over the last few years. New technology continues to come...